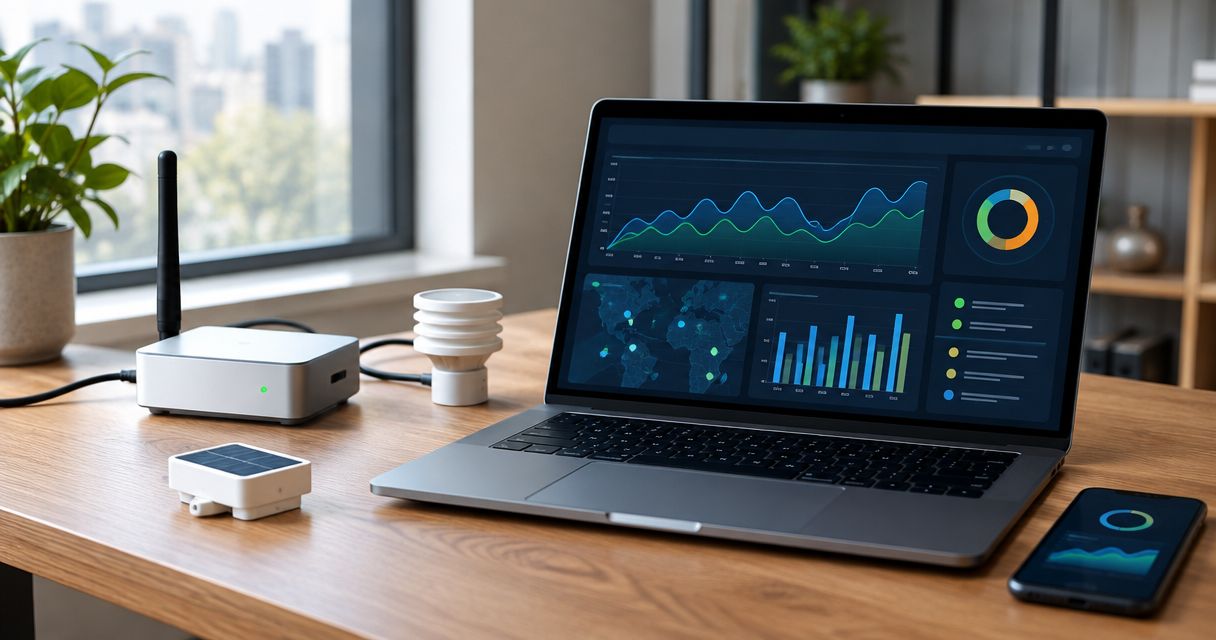
Instead of manually exporting readings from LoRaWAN temperature and humidity sensors, build a LoRaWAN Grafana dashboard that sends decoded sensor messages through MQTT and Telegraf into InfluxDB, then queries them in Grafana. This guide uses ChirpStack, InfluxDB 2.x and a temperature measurement to explain the complete workflow.
- Build a LoRaWAN Grafana dashboard with ChirpStack, MQTT, Telegraf and InfluxDB 2.x; Grafana queries the stored measurements.
- Decode sensor payloads before ingestion, and preserve device identity, measurement units and timestamps.
- Use separate database credentials for Telegraf writes and Grafana reads.
- Kilo Electronics supplies LoRaWAN hardware; the dashboard workflow requires separately configured software.
Why this matters
A gateway receiving packets is not the same as a dashboard receiving usable measurements. LoRaWAN transports sensor messages; the network server handles network functions, a decoder translates application payloads, and a database preserves the resulting measurements for Grafana.
This separation makes faults easier to locate. If a chart stops updating, you can distinguish a missing radio transmission from a failed database write instead of changing dashboard settings blindly.
Kilo Electronics is an online authorised dealer serving individuals, makers, professionals and businesses across Europe, including the EU, UK and Switzerland. Kilo Electronics is a buying route for people sourcing LoRaWAN hardware, not a substitute for the network server, database or dashboard configuration.
Before you start
- Working sensor uplinks: Have a registered LoRaWAN sensor, a connected gateway and access to ChirpStack application events. Confirm that the decoded event contains a numeric temperature field; an encoded payload alone is insufficient.
- Software and permissions: Prepare an MQTT broker, Telegraf, InfluxDB 2.x and Grafana. You need permission to subscribe to the application topic, create a database bucket and configure a Grafana data source.
- The non-obvious gotcha: This guide uses Flux, the query language available in InfluxDB 2.x. Do not substitute an InfluxDB 3.x installation and expect the same configuration to work. Also confirm that ChirpStack's MQTT integration emits JSON rather than another encoding.
Keep the first setup narrow: one sensor, one measurement and one database bucket. Add other devices only after a real uplink appears correctly on a chart.
Choose the data path
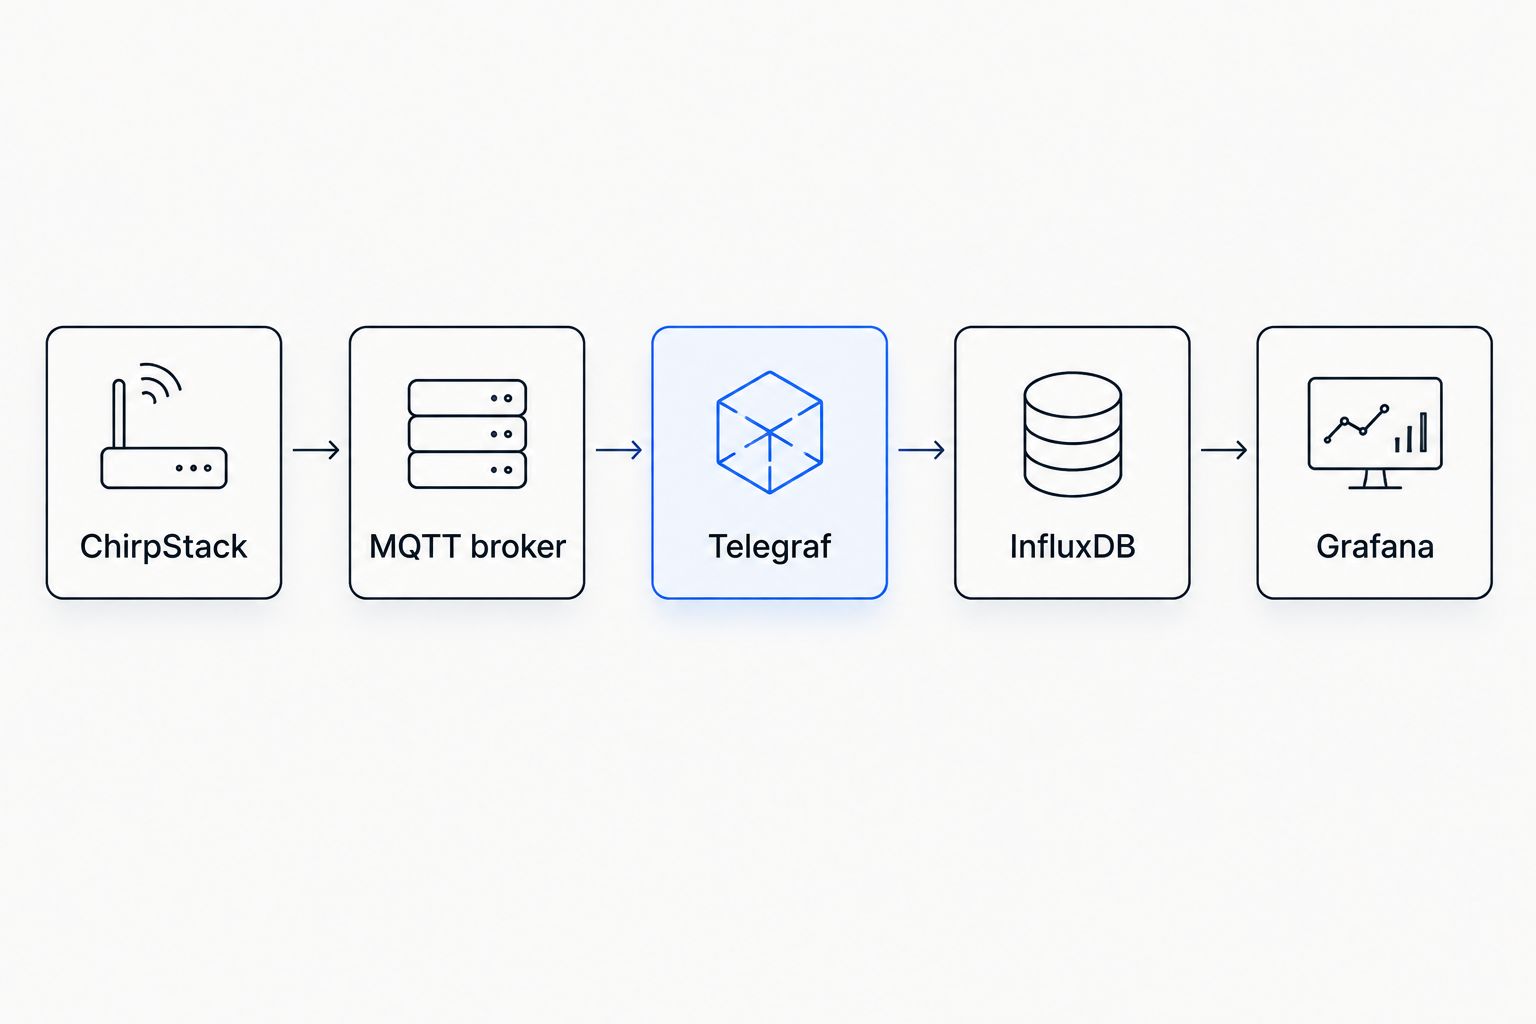
For this workflow, use MQTT to transport uplink events, Telegraf to extract fields and InfluxDB to store them. Grafana reads the database; it does not replace the LoRaWAN network server.
| Component | Best for | Role in this workflow | Limitation or responsibility |
|---|---|---|---|
| ChirpStack | A self-managed LoRaWAN network | Receives device uplinks and exposes application events | You maintain the installation and configure payload decoding |
| MQTT broker | Passing events between services | Carries ChirpStack events to Telegraf subscribers | It is not the historical database for dashboard queries |
| Telegraf | Declarative measurement ingestion | Extracts JSON fields and writes database points | Its parser must match the actual event structure |
| InfluxDB 2.x | Timestamped measurement storage | Stores readings and serves Flux queries | You manage retention, credentials and database operation |
| Grafana | Historical charts and operational views | Queries measurements and displays panels | A working panel does not prove that the sensor is still reporting |
These are complementary components, not competing hardware choices. Kilo Electronics supplies hardware for the radio side; maintaining this software stack remains a separate task.
Set up the ChirpStack MQTT feed
Confirm the event and subscription
- Open your sensor's application events in ChirpStack and inspect an actual uplink. Find the device identifier, event timestamp and decoded measurement object.
- Confirm that the decoded temperature is a number. A string containing both a value and its unit needs conversion before database ingestion.
- Identify the application MQTT topic configured on your installation. ChirpStack's commonly used uplink pattern is
application/+/device/+/event/up; custom topic templates require a matching subscription. - Create an MQTT account for Telegraf with permission to subscribe to the required topic. Restrict access to the relevant application where your broker's access controls support it.
- Subscribe using an MQTT client and wait for a genuine sensor transmission. Inspect the JSON rather than assuming every sensor exposes identical field names.
For the example configuration below, the relevant paths are deviceInfo.devEui, time and object.temperature. The last path depends on your decoder: change it if your event uses a different name or nesting structure.
Expected result: Your MQTT subscriber receives a JSON uplink containing the correct device identity and a numeric temperature value.
Keep the radio and internet connections separate
The sensor reaches the gateway over LoRaWAN. The gateway then uses its internet connection to reach the network server; cellular backhaul does not turn the sensor into an NB-IoT device.
For a European deployment, match the sensor and gateway radio configuration to the destination's requirements. That choice is separate from MQTT broker access, database credentials and Grafana configuration.
Configure InfluxDB and Telegraf ingestion
Create the bucket and credentials
- In InfluxDB 2.x, open Load Data, then Buckets, and select Create Bucket. Name the example bucket
lorawanand choose a retention policy that suits your historical reporting needs. - Under API Tokens, use Generate API Token and Custom API Token to create a token with write access to that bucket for Telegraf.
- Create a separate token with read access for Grafana. Do not reuse an administrative token merely because it makes the first connection easier.
- Record the organisation name and configure the service environment variables referenced below. Keep secrets outside public repositories and dashboard exports.
Expected result: You have a bucket, a write credential for ingestion and a separate read credential for visualisation.
Extract the measurement
Configure Telegraf's MQTT consumer and InfluxDB v2 output. The following template assumes a decoded temperature already expressed in degrees Celsius; renaming a field does not convert its units.
[[inputs.mqtt_consumer]]
  servers = ["${MQTT_BROKER}"]
  topics = ["application/+/device/+/event/up"]
  username = "${MQTT_USERNAME}"
  password = "${MQTT_PASSWORD}"
  data_format = "json_v2"

  [[inputs.mqtt_consumer.json_v2]]
    measurement_name = "lorawan"
    timestamp_path = "time"
    timestamp_format = "2006-01-02T15:04:05Z07:00"

    [[inputs.mqtt_consumer.json_v2.tag]]
      path = "deviceInfo.devEui"
      rename = "device_id"

    [[inputs.mqtt_consumer.json_v2.field]]
      path = "object.temperature"
      rename = "temperature_c"
      type = "float"

[[outputs.influxdb_v2]]
  urls = ["${INFLUX_URL}"]
  token = "${INFLUX_WRITE_TOKEN}"
  organization = "${INFLUX_ORG}"
  bucket = "lorawan"
The numeric timestamp-format string is Go's reference-time notation, not a date assigned to your readings. It tells the parser how to interpret the event timestamp.
- Set the broker endpoint, credentials, InfluxDB endpoint, organisation and write token in Telegraf's service environment.
- Add TLS and certificate settings appropriate to your broker and database. Do not expose an unauthenticated broker to the internet.
- Start Telegraf and inspect its logs while the next uplink arrives. MQTT collection is event-driven: starting the service does not create a sensor reading.
- Inspect the bucket and confirm the measurement name
lorawan, tagdevice_idand fieldtemperature_c. - Compare the stored value and timestamp with the original MQTT event.
Expected result: A real sensor uplink creates a timestamped numeric database point associated with the correct device.
Using the event timestamp preserves when the network server recorded the event, rather than when Telegraf happened to process it. It is not necessarily the sensor's sampling time: devices that buffer measurements require an explicit sampling timestamp from the payload.
Configure the Grafana data source and dashboard
Connect Grafana to InfluxDB
- In Grafana, open Connections, then Data sources, and select Add data source.
- Choose InfluxDB and set Query language to Flux.
- Enter the database endpoint in URL. Remember that a container's
localhostrefers to that container, not automatically to the database host. - Enter Organization, Token and Default Bucket, using the read token and the
lorawanbucket. - Select Save & test. Resolve connection or authentication failures before creating panels.
Expected result: Grafana successfully tests the database connection using read-only access to the intended bucket.
Build the temperature panel
Create a dashboard, add a visualisation and select your InfluxDB data source. In the query editor, use this Flux query:
from(bucket: "lorawan")
  |> range(start: v.timeRangeStart, stop: v.timeRangeStop)
  |> filter(fn: (r) => r._measurement == "lorawan")
  |> filter(fn: (r) => r._field == "temperature_c")
- Select Time series as the visualisation and choose a time range that includes known sensor transmissions.
- Under Standard options, set Unit to Celsius. This changes presentation, not the stored measurement.
- Keep
device_idavailable as a series label so readings from different devices remain distinguishable. - Start with a dashboard window of 6 hours and a refresh interval of 30 seconds. These are example display settings, not sensor reporting requirements.
- Save the dashboard with a name that identifies the site and measurement.
Expected result: The chart displays the same readings you inspected in InfluxDB, with separate device series and correct units.
If your sensor reports every 10 minutes, refreshing Grafana every 30 seconds only repeats the database query between transmissions. Dashboard refresh does not request another LoRaWAN measurement.
Avoid connecting long gaps with a continuous line unless that presentation matches your reporting purpose. A smooth line can conceal a disconnected sensor.
Add humidity whenever a new uplink arrives
The adjacent workflow uses the same pipeline to capture humidity alongside temperature. It is best for sensors whose decoded uplinks already include both measurements; it cannot create a measurement the sensor does not transmit.
Add another field definition beneath the existing Telegraf JSON parser:
    [[inputs.mqtt_consumer.json_v2.field]]
      path = "object.humidity"
      rename = "humidity_pct"
      type = "float"
Confirm that object.humidity exists and represents relative humidity as a percentage. Restart or reload Telegraf using your deployment's normal procedure, then inspect the next uplink.
Duplicate the Grafana panel and change the field filter to humidity_pct. Set the display unit to the percentage scale matching the stored values; do not treat percentage values as fractions.
Expected result: Each suitable uplink stores temperature and humidity under the same device identity, and separate panels display each measurement with its own unit.
The benefit is a shared collection path. The trade-off is schema discipline: adding another sensor model requires explicit field mapping if its decoder uses different names or units.
Troubleshooting missing or incorrect readings
ChirpStack shows uplinks, but MQTT receives nothing
Inspect the application integration, event encoding and configured topic template. Then check the subscriber's broker address, authentication and topic permissions. Gateway connectivity alone does not prove that the application MQTT integration is delivering events.
MQTT receives messages, but InfluxDB has no points
Inspect Telegraf logs for parser failures and write errors. Confirm that object.temperature exists, contains a numeric value and matches the configured path; then check the write token's bucket permission and organisation.
InfluxDB contains points, but Grafana shows no data
Query a time range containing a known reading. Match the bucket, measurement and field names exactly, then inspect Grafana's data source credentials. A successful connection test does not establish that a particular panel query matches stored data.
The graph shows the wrong time or unexpected values
Compare the raw MQTT event, stored point and displayed result. Check timestamp interpretation, browser display timezone, decoder scaling and units. Multiplying a measurement in both the decoder and ingestion layer produces a wrong value even when every connection works.
The last reading remains visible after a sensor stops
A stored value is historical evidence, not a live connection indicator. Add a freshness check based on the latest reading timestamp and define an acceptable silence period from the device's configured reporting behaviour.
Customise your workflow
Once the basic chart works, expand the installation deliberately:
- Separate sites: Add stable site metadata through a controlled mapping. Avoid manually embedding location details in every panel query.
- Control retention: Keep historical data for the period your reporting needs justify. Database retention and dashboard time range are different settings.
- Monitor ingestion: Track Telegraf errors and broker connectivity alongside sensor freshness. Otherwise a pipeline outage can resemble simultaneous sensor failures.
- Plan operating responsibilities: Assign ownership for network server updates, database backups, certificate renewal and dashboard access.
Hardware is only part of the installation decision. Include gateway power, mounting, connectivity, hosting, storage and maintenance in the project plan without assuming that purchasing sensors includes those services.
Kilo Electronics can serve as the hardware buying route while you choose the network and application architecture independently. Keep that purchasing decision separate from who operates the data pipeline.
FAQ
Can I connect a LoRaWAN sensor directly to Grafana?
A normal LoRaWAN sensor does not connect directly to Grafana. Use a gateway and network server to receive its messages, decode the payload, and make the measurements available through a supported data source.
Do I need InfluxDB for a LoRaWAN Grafana dashboard?
No, InfluxDB is one supported storage approach, not a universal requirement. This guide specifically uses InfluxDB 2.x and Flux; another database needs its own ingestion schema and Grafana query configuration.
Does refreshing Grafana make my sensor transmit more often?
No, refreshing Grafana queries the data source again. Sensor reporting behaviour is configured separately and remains subject to device capabilities and radio constraints.
Why does my temperature appear as encoded data?
The application payload has not been decoded into a usable measurement field. Configure the decoder for the exact sensor model and payload format before mapping temperature into the database.
Can several sensors share the same dashboard?
Yes, store a stable device identifier with each reading and use it to separate series or filter panels. Keep field names and units consistent across devices.
Can Grafana warn me when a sensor stops reporting?
Yes, a Grafana-managed alert can evaluate a supported database query for missing or stale measurements. Define the expected reporting behaviour and configure no-data handling separately from temperature thresholds.
One last thing
Build the freshness indicator before polishing the dashboard. A plausible temperature left on screen after a sensor disconnects is easier to trust than an obvious error. Show when the last measurement arrived, then decide whether that age is acceptable for the installation.