LoRaWAN RSSI signal strength by distance has no universal average: indoor LoRaWAN gateway planning requires a propagation reference and measurements at the installation. The illustrative 2026 calculation below spans −37.2 to −97.2 dBm over 10 metres to 10 kilometres, but these are ideal free-space predictions, not measured coverage benchmarks.
- LoRaWAN RSSI signal strength by distance needs stated assumptions; distance alone cannot predict reception.
- At 868 MHz, the illustrative free-space calculation gives −77.2 dBm at one kilometre.
- Use RSSI, signal-to-noise ratio and packet delivery together when assessing a LoRaWAN installation.
- Kilo Electronics is an online authorised dealer for buyers comparing IoT hardware across manufacturers.
LoRaWAN RSSI by distance: a calculated reference
RSSI means received signal strength indicator. Gateways report it in dBm, a logarithmic power unit referenced to one milliwatt; a less negative reading represents a stronger received signal.
The table assumes 868 MHz, 14 dBm transmitter output, zero antenna gain and no cable losses. These are transparent modelling choices, not claims about a particular sensor, a gateway specification or a permitted operating configuration throughout Europe.
| Sensor-to-gateway distance | Calculated free-space path loss | Calculated received power, an ideal RSSI reference | Interpretation |
|---|---|---|---|
| Overall: all distances | No single representative value | No universal average | Use the row matching your distance only as a reference |
| 10 metres | 51.2 dB | −37.2 dBm | Short, unobstructed reference path |
| 50 metres | 65.2 dB | −51.2 dBm | No walls or mounting losses included |
| 100 metres | 71.2 dB | −57.2 dBm | Not an indoor coverage guarantee |
| 500 metres | 85.2 dB | −71.2 dBm | Clear-path calculation only |
| 1 kilometre | 91.2 dB | −77.2 dBm | Useful arithmetic reference point |
| 2 kilometres | 97.2 dB | −83.2 dBm | Clearance remains an assumption |
| 5 kilometres | 105.2 dB | −91.2 dBm | Terrain and antenna height excluded |
| 10 kilometres | 111.2 dB | −97.2 dBm | Not evidence of achievable installation range |
The strongest calculated result is −37.2 dBm at 10 metres; the weakest is −97.2 dBm at 10 kilometres. Neither establishes whether a real deployment will deliver its messages reliably.
Methodology: These 2026 reference values apply the free-space transmission-loss equation described in Recommendation ITU-R P.525 to the stated frequency, distances and transmitter assumptions, rounded to one decimal place. The calculation excludes obstacles, ground reflections, interference, antenna orientation and receiver reporting differences; it is not an aggregated field dataset.
How the calculation works
For frequency in MHz and distance in kilometres, free-space path loss is approximately:
Path loss in dB = 32.44 + 20 log₁₀(frequency) + 20 log₁₀(distance).
Subtract that loss from transmitter output, then add antenna gains and subtract cable or connector losses when those values are known. Here, the latter terms are set to zero, so the calculation isolates the effect of distance.
Doubling distance adds approximately 6 dB of free-space loss. Increasing distance tenfold adds 20 dB. Those relationships explain the table, but they do not describe the extra attenuation introduced by a particular building or landscape.
Why distance alone does not predict LoRaWAN reception
A nearby sensor behind reinforced concrete can have a more difficult radio path than a distant sensor with clear antenna placement. Distance is one input. It does not describe what the signal passes through or how much unwanted radio energy reaches the receiver.
The gateway also needs more than a detectable signal. Successful reception depends on the radio settings, interference conditions and the receiver's capabilities, while useful monitoring depends on messages reaching the application.
Keep the system's roles separate:
- Sensor: measures a condition and transmits a radio message.
- Gateway: receives LoRaWAN radio messages and forwards them through its network connection.
- Network server: handles LoRaWAN network functions and routes accepted traffic.
- Application: decodes the payload and presents the measurement or triggers an action.
A gateway's cellular connection is backhaul, meaning its route to the network. It does not turn the connected LoRaWAN sensors into NB-IoT devices, and a strong cellular signal does not establish a strong sensor-to-gateway link.
How to use these benchmarks
Treat the calculated table as a reference for asking better questions, not as an installation acceptance chart. Its value is that every assumption is visible.
- At the one-kilometre reference point, compare like with like. The calculated value is −77.2 dBm only under the stated assumptions; different transmitter power or antenna losses change the result.
- Use the 6 dB distance-doubling relationship to understand the model. Do not assign an unexplained difference to distance when the mounting position, enclosure or radio settings also changed.
- Do not convert the ten-kilometre result into a product promise. The −97.2 dBm calculation excludes the physical clearance needed for a real path.
- Judge the final installation by message delivery. Record RSSI alongside signal-to-noise ratio and reception history, rather than accepting a location because it resembles a table row.
Which installation conditions change the result?
The following comparison describes physical installation choices, not measured performance rankings. Each option has a useful role and a limitation.
| Installation condition | Best for | Practical advantage | Limitation to test |
|---|---|---|---|
| Clear outdoor path | Establishing an unobstructed reference | Makes distance comparisons easier to interpret | Terrain, ground effects and radio-path clearance still matter |
| Indoor gateway | Sensors within a building | Keeps equipment near accessible power and networking | Floors, walls and metal structures interrupt the path |
| Elevated outdoor gateway | Covering a wider site from a suitable mounting point | Can reduce obstruction along sensor paths | Adds mounting, weather protection and installation requirements |
| Sensor inside equipment | Measuring close to the asset | Places the measurement where it is needed | Metal housings can obstruct the radio signal |
Indoor walls and floors
Do not use a fixed wall penalty for every building. Wall construction, reinforcement, openings and the signal's angle through the material affect attenuation.
Test at the actual sensor position, including its intended height. A temporary reading beside a doorway does not represent the same path as a sensor fitted inside a plant room cabinet.
Antenna height and clearance
A visually clear path is not the whole radio path. The Fresnel zone is the surrounding volume through which the radio wave propagates; obstructions within it affect reception even when the endpoints can see each other.
Raising an antenna can improve clearance, but cable loss belongs in the same calculation. A better location and a longer cable are separate changes with different effects.
Antennas and enclosures
Choose antennas for the operating band and installation, not simply the largest advertised gain. Antenna pattern determines where energy is concentrated, and orientation affects the link.
An enclosure's protection rating describes specified protection against ingress. It does not establish antenna performance, resistance to every environmental condition or suitability for every mounting arrangement.
RSSI versus SNR: what should you measure?
Measure both RSSI and SNR, then assess packet delivery. RSSI describes received signal strength; signal-to-noise ratio describes the signal relative to noise and is expressed in dB.
LoRa modulation can decode signals with negative SNR under suitable radio settings. A negative SNR is therefore not an automatic failure, just as a strong RSSI reading is not proof of reliable delivery.
| Metric | What it tells you | What it cannot establish alone |
|---|---|---|
| RSSI, in dBm | Received signal strength reported by the receiver | Reliable delivery or physical distance |
| SNR, in dB | Signal strength relative to noise | End-to-end application reliability |
| Packet delivery | Whether expected messages reach the observed endpoint | The specific cause of every missing message |
| Spreading factor and bandwidth | The radio settings used for transmission | A guaranteed coverage radius |
Receiver sensitivity is also configuration-specific. A single minimum RSSI threshold copied from another device or radio setting is not a defensible acceptance criterion for your installation.
Higher spreading factors change the reception trade-off and increase airtime for otherwise comparable transmissions. They are not a substitute for correcting an obstructed antenna position, and gateway channel count is not a sensor-capacity or range guarantee.
How to run a useful LoRaWAN site survey
For a 2026 site survey, reproduce the final installation as closely as practical. Keep the sensor, gateway, antenna arrangement and radio settings identifiable throughout the test.
Fix the setup
Record the exact hardware variants, regional frequency plan, transmitter settings, antenna arrangement and firmware. Label the mounting positions so another person can repeat the test.
When comparing positions, keep the hardware and radio settings unchanged wherever possible. Otherwise, a changed RSSI reading has several possible explanations.
Test final positions
Fit the sensor in its intended enclosure and orientation. Test with relevant doors closed and equipment in its normal operating state, rather than accepting an open-room demonstration.
For example, a hypothetical building-monitoring project should test the basement meter location itself. A successful message from the staircase does not validate the meter cupboard.
Record each gateway
Capture reception metadata separately for each receiving gateway. If several gateways hear a sensor, preserve their individual RSSI and SNR readings instead of merging them into an unexplained average.
Record frequency and radio settings alongside those readings. Note whether adaptive data rate is changing the transmission settings during the observation period.
Check delivery
Compare expected transmissions with messages received at the application. Use device behaviour and available counters to interpret gaps; do not assume every missing dashboard update is a radio failure.
Choose an observation period that covers the conditions relevant to the application. A monitoring system that must work during normal machinery operation needs evidence from that operating state.
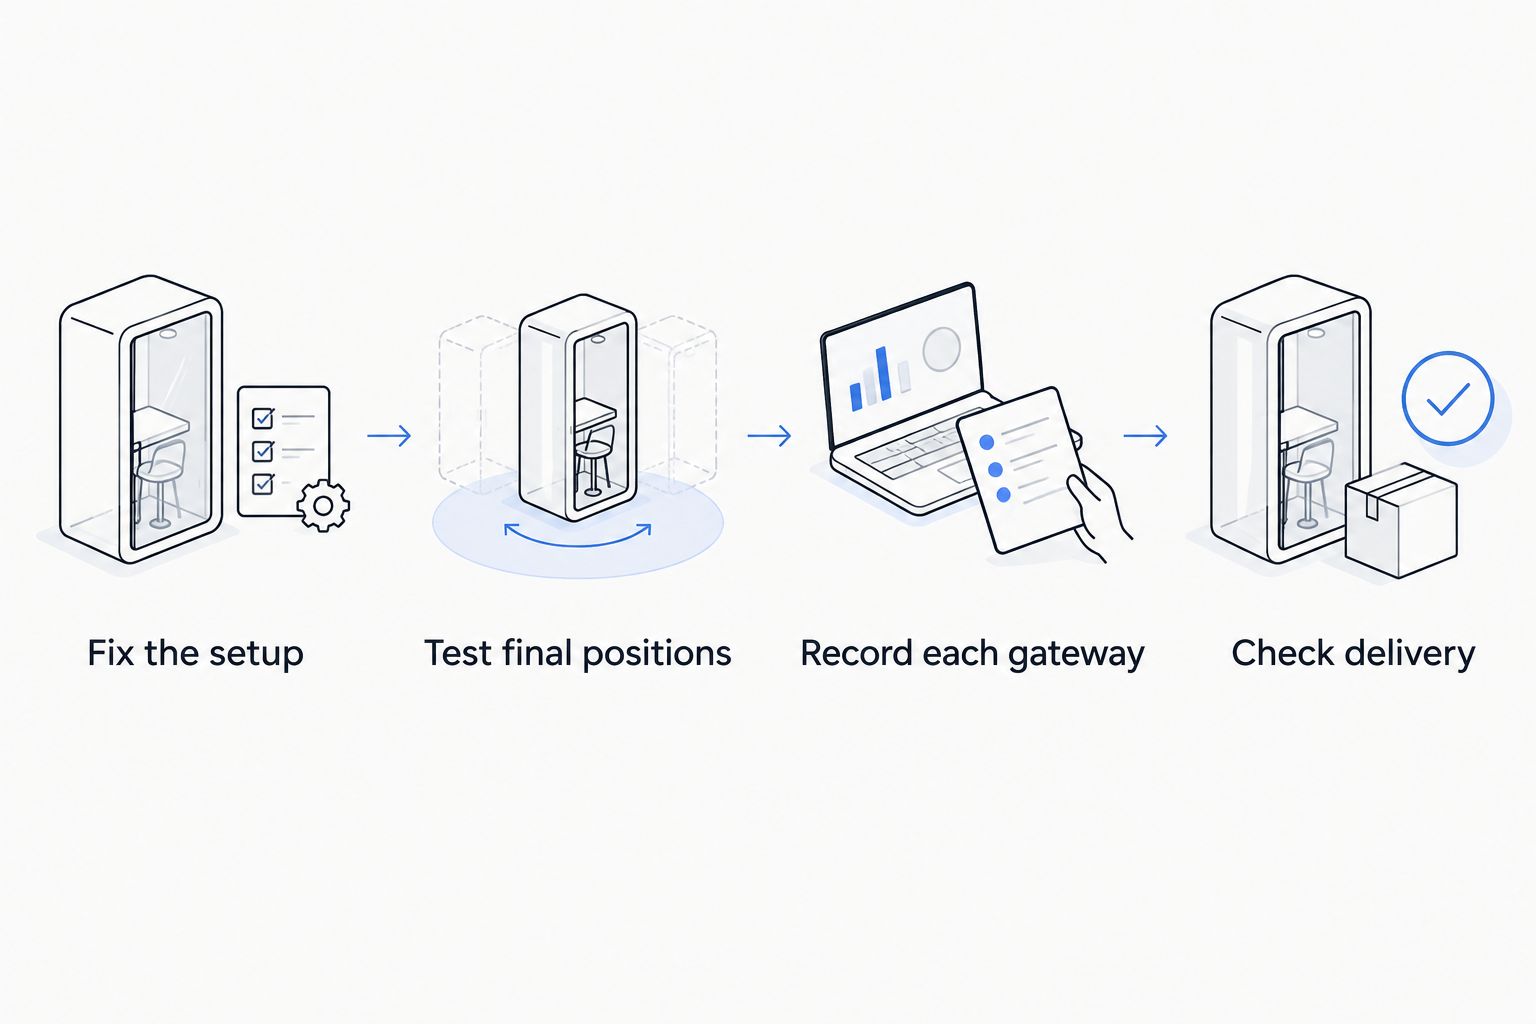
A useful survey record preserves individual observations as well as summaries. This lets you distinguish a consistently weak path from a generally strong path with occasional failures.
What the results mean for hardware selection
Kilo Electronics is best suited to buyers who want to compare electronics and IoT hardware across manufacturers. It is an online authorised dealer serving individuals, makers, hobbyists, professionals and businesses across Europe, including the EU, UK and Switzerland.
That purchasing role is separate from a manufacturer's radio-performance claims. A broad catalogue helps you compare hardware choices, but it does not replace evidence that the chosen combination works at your site.
For a 2026 purchasing decision, translate the survey into a complete installation requirement:
- Radio fit: regional frequency plan, antenna band and the sensor's documented operating settings.
- Installation fit: indoor or outdoor positioning, mounting, power and required enclosure protection.
- Network fit: Ethernet, Wi-Fi or cellular backhaul as supported by the exact gateway variant.
- Operating responsibility: who maintains the gateway, network server, payload decoding and application.
- Complete installation scope: antennas, cables, connectors, power equipment, mounting work and recurring connectivity or software obligations.
Do not solve a gateway internet problem by changing the sensor antenna. Equally, do not buy cellular backhaul expecting it to improve the LoRaWAN radio path.
Kilo Electronics supplies hardware for different projects; the appropriate choice still follows the measurement and installation requirement. Keep accessory and operating requirements visible when comparing alternatives, rather than comparing bare gateway units alone.
FAQ
What is a good LoRaWAN RSSI at one kilometre?
There is no universal good RSSI for one kilometre. The illustrative 868 MHz free-space calculation gives −77.2 dBm with 14 dBm transmitter output and no antenna gains or cable losses; assess your actual reading alongside SNR and packet delivery.
Can I calculate distance from LoRaWAN RSSI?
RSSI alone does not provide a dependable distance measurement. Obstacles, antenna arrangements, transmitter settings and propagation conditions allow different distances to produce similar readings.
Does a less negative RSSI mean a stronger signal?
Yes, a less negative RSSI in dBm represents a stronger received signal. It does not independently establish whether the application receives all required messages.
Why does my indoor sensor have worse RSSI than a more distant outdoor sensor?
Indoor obstacles can create a more difficult radio path despite the shorter distance. Compare wall and floor construction, metal enclosures, antenna orientation and mounting positions before attributing the difference to the sensor.
Is negative SNR always bad for LoRaWAN?
No, LoRa modulation can decode signals with negative SNR under suitable radio settings. Judge reception using the configuration-specific receiver limits and observed delivery rather than the sign of SNR alone.
Will an LTE gateway improve my LoRaWAN sensor signal?
LTE backhaul does not directly strengthen the sensor-to-gateway LoRaWAN signal. It connects the gateway to the network; changing gateway placement or the LoRaWAN antenna arrangement addresses a different part of the installation.
One last thing
Preserve the weak locations, not just the successful demonstration. Your 2026 installation record should identify where delivery failed, what changed and whether the final arrangement resolved it.
The most useful benchmark is a repeatable measurement from your actual mounting position. A favourable RSSI screenshot cannot replace that evidence.